


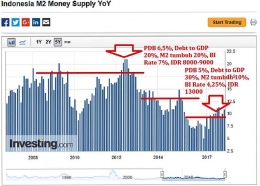

Let's have look to the main evidence why debt to gdp ratio now are at the "safe" point, that's f**kin BS! semakin besar rasionya semakin menekan pertumbuhan likuiditas yang ada, mari kita lihat buktinya melalui grafis olahan dari saya yang menjelaskan mengapa BI memperlonggar kebijakan moneter dengan harapan likuditas akan kembali tumbuh! tell you what that things is not gonna happen!
here take a good look at M2 supply growth chart, take out from Investing.com
M2 is a monetary aggregate that includes all physical currency circulating in the economy (banknotes and coins), operational deposits in central bank, money in current accounts, saving accounts, money market deposits and small certificates of deposit. Excess money supply growth potentially can cause inflation and generate fears that the government may tighten money growth by allowing the interest rates to rise which in turn, lowers future prices. M2 = Currency in circulation + demand deposits (private sector) + time and savings deposits (private sector).